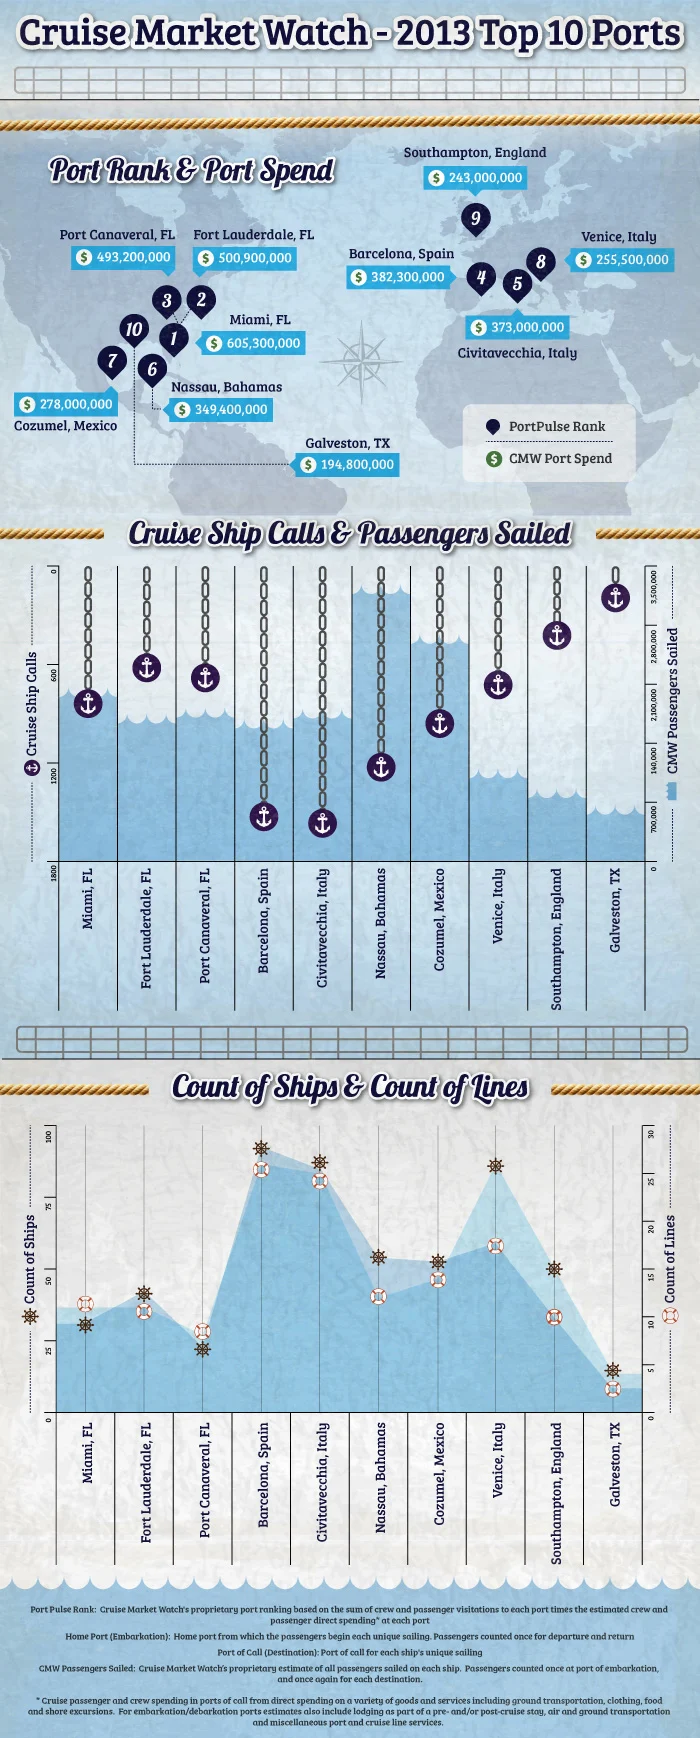
The newly released data, presented through an interactive and detailed infographic by Cruise Market Watch, offers an in-depth breakdown of the world’s premier maritime destinations. By examining critical metrics such as destination itineraries, scheduled sailing days, and the maximum passenger capacities of the vessels calling on these ports, the report maps out the geographic and operational centers of gravity for the global cruise industry.

Understanding which ports capture the highest passenger traffic is essential for comprehending broader trends in international travel and tourism. Cruise ports are not merely temporary docking stations; they are complex logistical ecosystems that require sophisticated infrastructure to manage thousands of vacationers arriving simultaneously. The 2013 data underscores the immense scale of operations required to sustain the world’s most popular cruise itineraries, reflecting both the popularity of established regional hubs and the competitive nature of port management worldwide.
Behind the numbers lies a robust methodology drawing from multiple authoritative sources within the maritime and tourism sectors. According to Cruise Market Watch, the foundational data regarding ship itineraries, operational days at sea, and vessel passenger capacities are compiled directly from their proprietary industry databases. To calculate secondary economic impacts—such as crew and passenger debarkation rates, as well as estimated spending patterns by visitors while ashore—the analysis incorporates research and metrics provided by Business Research & Economic Advisers, the Florida-Caribbean Cruise Association, and the Cruise Lines International Association.

This multi-faceted approach ensures that the evaluation of the world’s top ten cruise ports goes beyond simple headcounts, offering a clearer picture of how these destinations interact with the broader cruise ecosystem. Passenger spending in port cities plays a vital role in local commerce, supporting retail businesses, excursion operators, restaurants, and transportation networks. Similarly, crew expenditures contribute significantly to the economic vitality of port communities, making the debarkation metrics highlighted in the Cruise Market Watch report a crucial indicator of port value.
As the cruise industry continues to evolve, data insights from trusted analysts like Cruise Market Watch remain invaluable for tracking shifts in global travel preferences. Whether identifying emerging regional favorites or reaffirming the dominance of traditional maritime capitals, the 2013 top ten ports ranking serves as a definitive benchmark for understanding where and how millions of cruise passengers spend their time at sea and on shore.