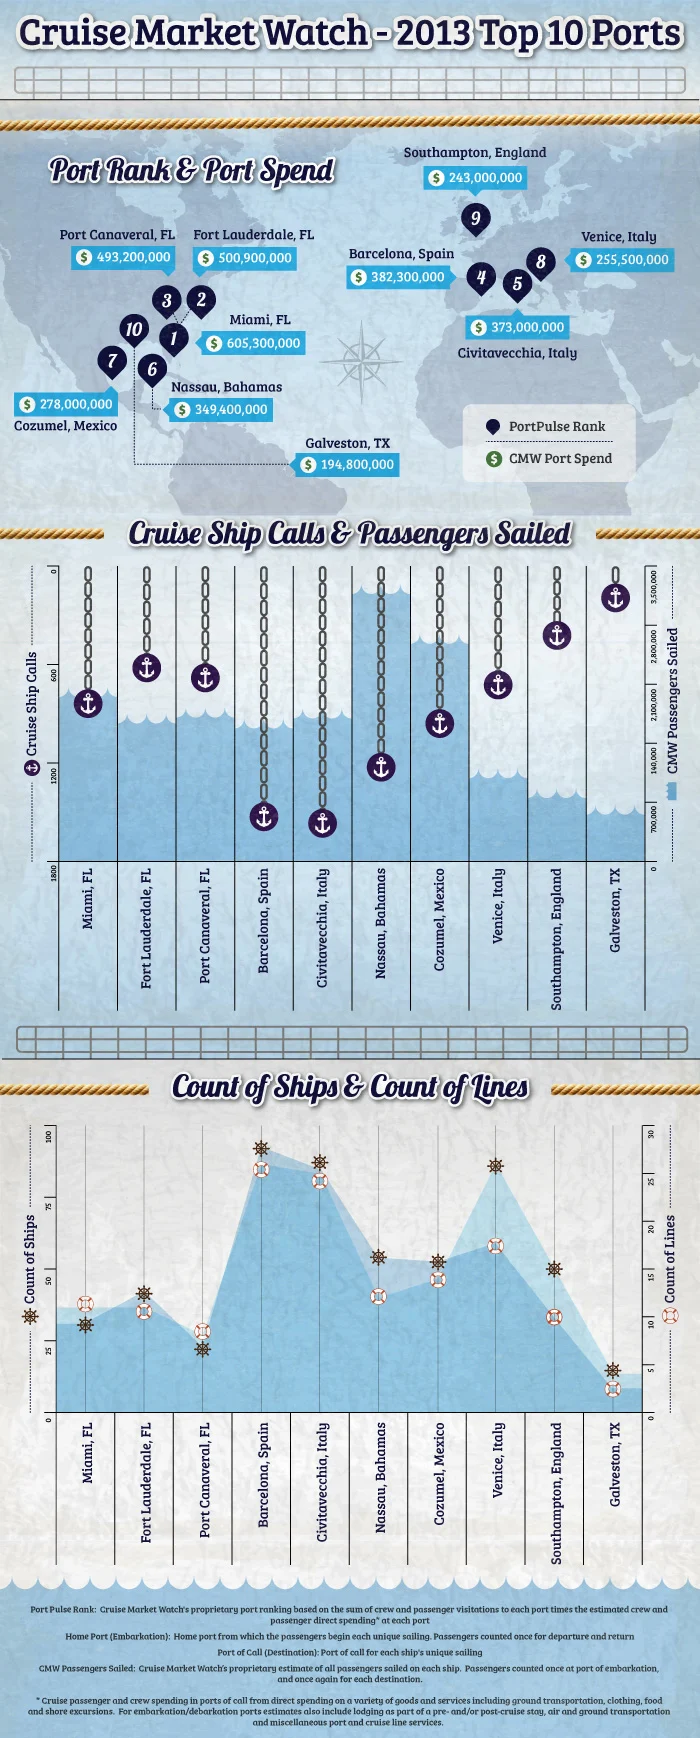
As the global cruise industry continues to experience dynamic shifts in passenger traffic, destination preferences, and economic impact, Cruise Market Watch has released its comprehensive data and accompanying infographic detailing the top 10 cruise ports in the world for 2013. Published on March 14, 2013, the report offers industry analysts, travelers, and maritime stakeholders a close look at the destinations capturing the lion’s share of global cruise tourism during that year.

The newly released data highlights the heavy hitters of the international cruising landscape, mapping out the ports that serve as the primary gateways for millions of vacationers embarking on voyages across the globe. By examining a combination of unique destination itineraries, total sailing days, and individual ship passenger capacities, Cruise Market Watch has compiled a definitive ranking that underscores the sheer scale of modern cruise operations.
Understanding where travelers embark and debark is essential for grasping the broader economic footprint of the cruise sector. Beyond simply counting the number of ships docking at a particular pier, the analysis incorporates crucial economic metrics, including crew and passenger debarkation rates, alongside estimated port spending. These figures are derived from authoritative industry sources such as Business Research and Economic Advisers, the Florida-Caribbean Cruise Association, and the Cruise Lines International Association. Together, these organizations provide a comprehensive framework for measuring how port cities benefit financially from the influx of maritime travelers who patronize local businesses, shore excursions, and hospitality services during their port calls.

The release of the 2013 top 10 ports infographic comes at a time when the cruise industry is characterized by steady expansion and evolving passenger demographics. Major cruise lines continue to deploy increasingly massive vessels capable of carrying thousands of guests at a time, putting unique logistical demands on port infrastructure worldwide. Cities that feature prominently in the top rankings must continually adapt to handle high concentrations of transient visitors efficiently, balancing the economic windfalls of tourism with local capacity constraints and environmental considerations.
The data provided by Cruise Market Watch serves as a vital benchmark for industry observers tracking the shifting tides of global tourism. Whether examining the dominance of Caribbean mega-ports or the rising prominence of European and other international hubs, the insights drawn from these metrics shed light on the operational realities behind the glamorous marketing campaigns of major cruise operators. As stakeholders review the newly detailed figures, the infographic remains a key resource for understanding the interconnected web of logistics, economics, and consumer choices that drive the contemporary cruise market.